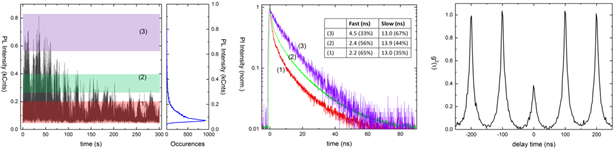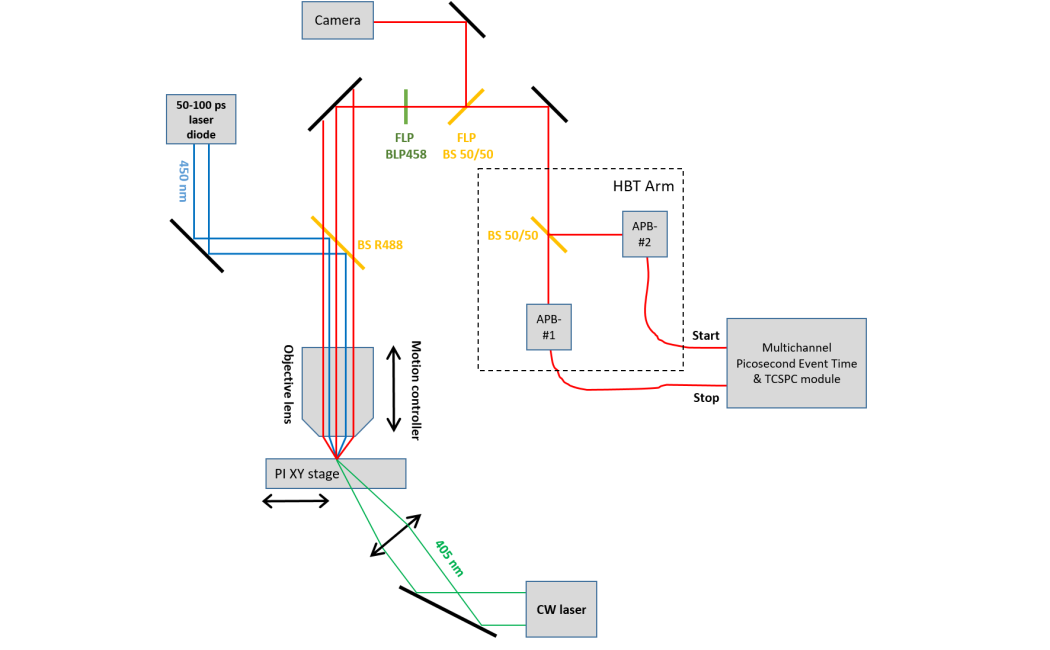
Micro-PL refers to spatially-resolved photoluminescence (PL) experiments with a spatial resolution around or better than 1 micrometer. In the group we have a home-built micro-PL setup, which is shown in Figure 1. A laser pump pulse (HORIBA JOBIN YVON, Delta Diode 450) is reflected from the beam splitter (Semrock BS R488) and steered into the objective lens (Olympus UPlanFL N 100*1.30 Oil Iris). The objective lens is remotely controlled by a motion controller in the vertical Z-direction, so as to focus the pump on the PI XY stage (PI Line M-686 D64 XY stage) where the sample is placed. To image the field of view and select appropriate sample areas for the experiments, we use a continuous laser (Cobolt MLD 405) in conjunction with a CCD camera (Thorlabs DCC1645C). Following photo excitation, the photoluminescence of the sample area is collected by the objective lens, and then transmitted through the beam splitter (BS R488), before it enters the HBT (Hanbury-Brown-Twiss) Arm of the setup, which includes a beam splitter (BS 50/50) and a pair of APD detectors. The high sensitivity of the APD detectors allows single photon counting. For the data acquisition, we use a multichannel picosecond event time & TCSPC module (Hydra Harp 400, PicoQuant). The software allows us to extract the PL blinking trace, the PL intensity histogram and lifetime, as well as the second-order correlation. Figure 2 shows an example of micro-PL results obtained on CdSe/CdS quantum dot samples.
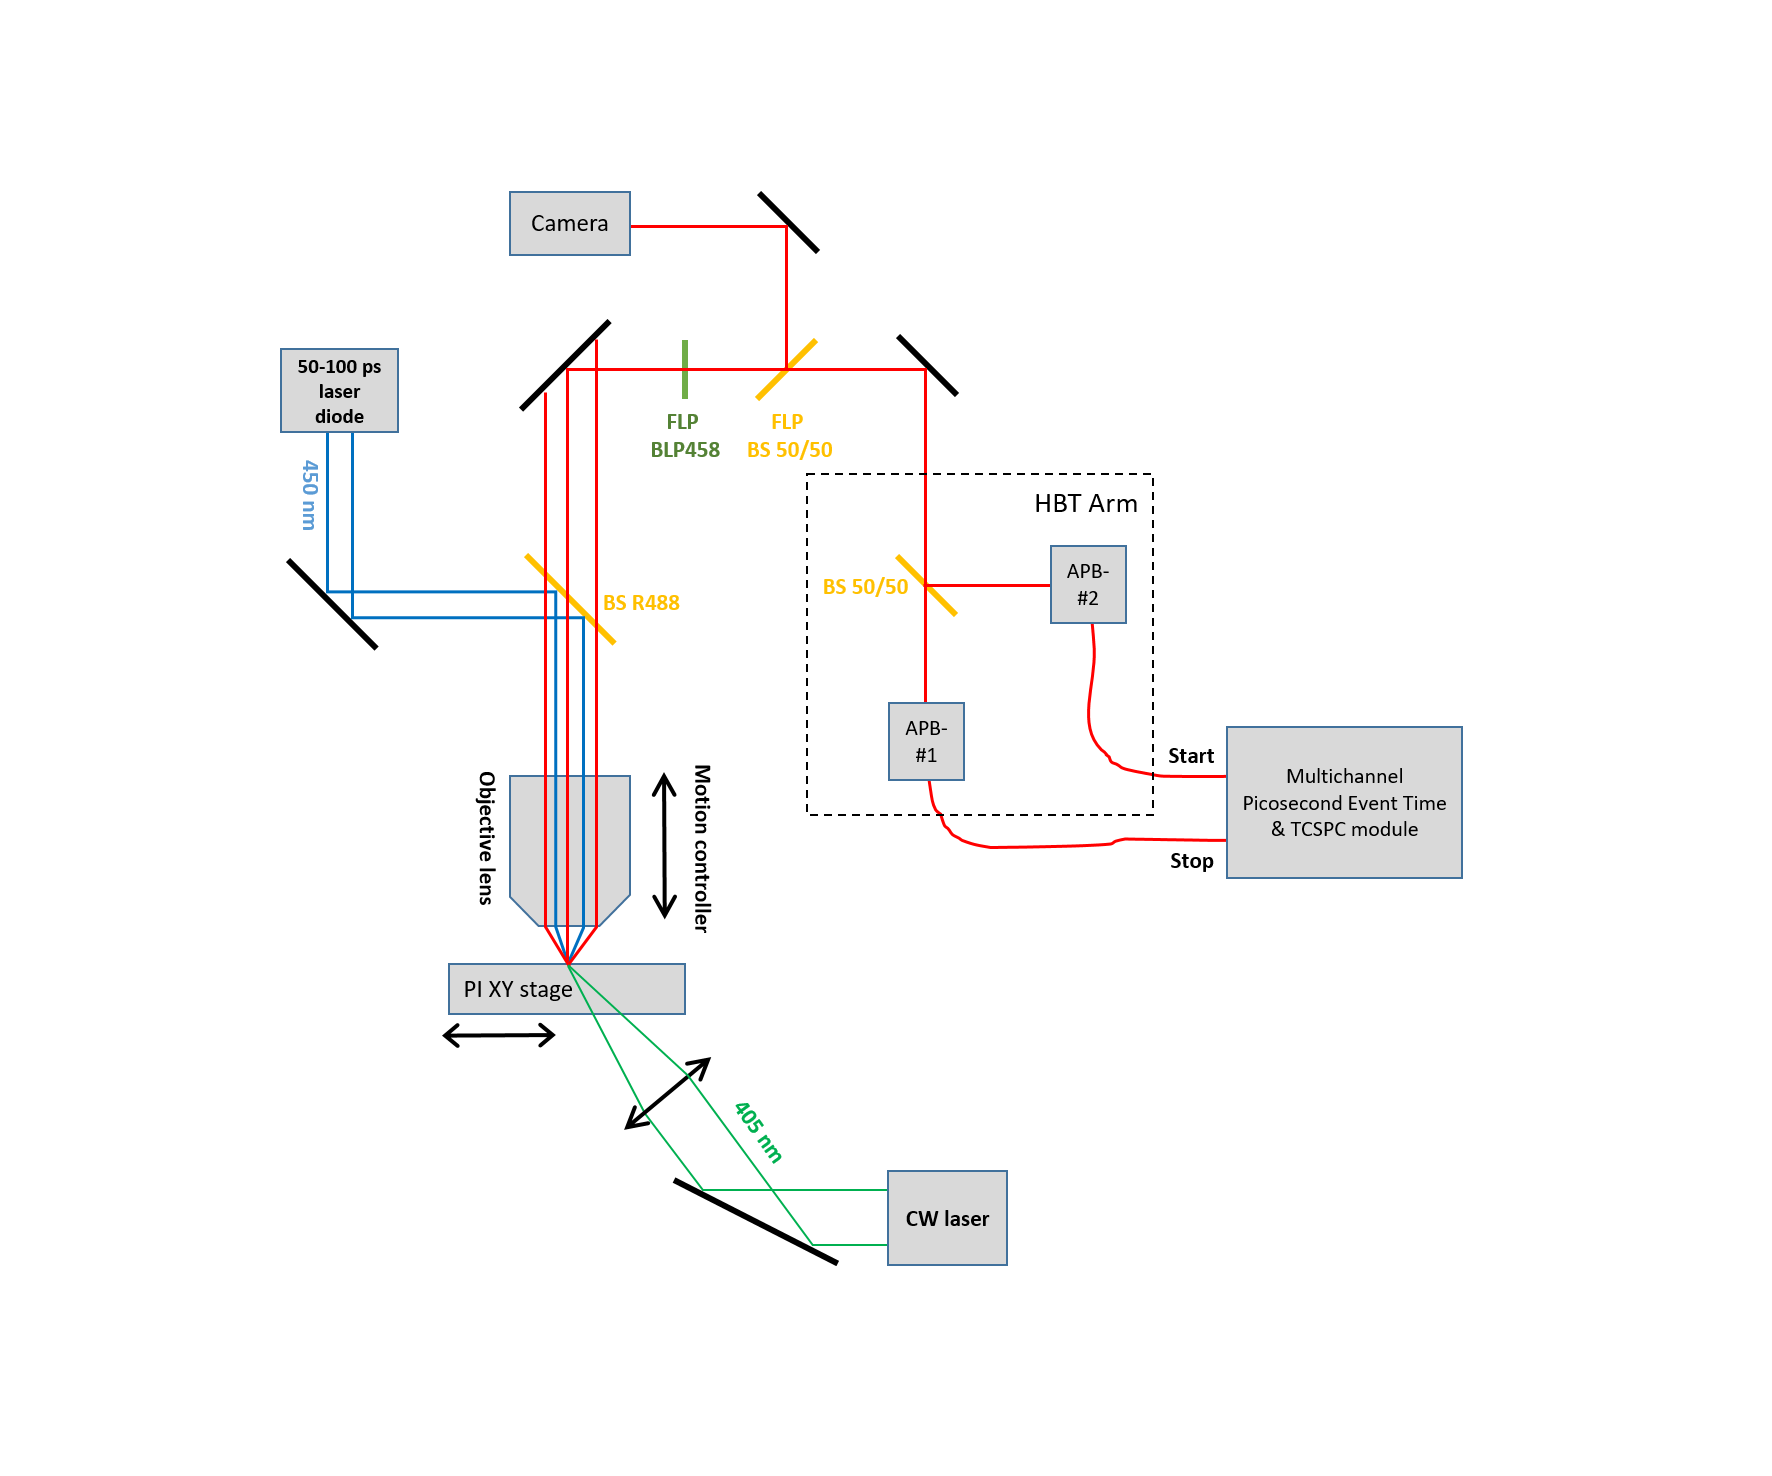
Figure 1: The scheme of the micro-PL setup.